")
")
")
")
Maps
Location Data Visualized in Beautiful Maps

Interactive Maps
Filter data and show mouseover summaries
Drill down into Location-Specific Data
Drill down into Location-Specific Data
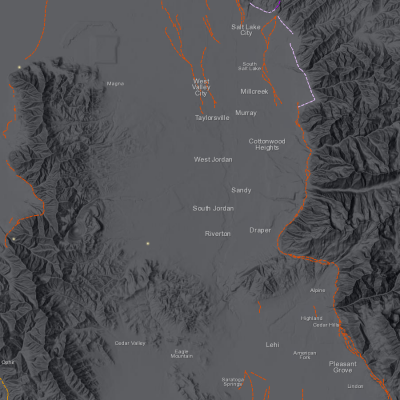
Stunning Basemaps
Choose what looks best to you
Sourced from leading cartographers
Sourced from leading cartographers

View Metrics on Maps
Through circle size and color
Succinct visuals
Succinct visuals
Lines & Paths
Map Routes Easily
Add data to these routes
Add data to these routes
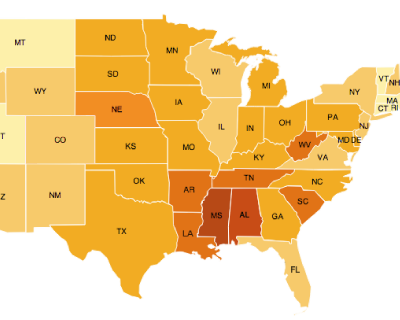
Choropleth Maps
Group information by Geographical Regions
States, cities, capitals, postal districts
States, cities, capitals, postal districts

Map Street Level Information
Geographic Precision
Features to map data by addresses
Features to map data by addresses
POPULAR CHARTS
Frequently Used & Well-Known Formats
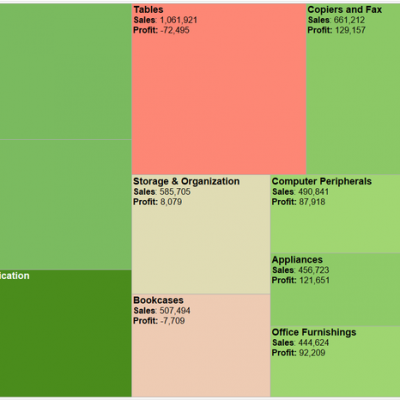
Tree Maps
Nice for Pattern Finding
Analyze information within categories
Analyze information within categories
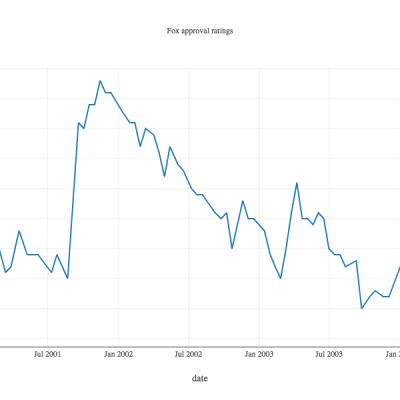
Time Series Charts
Bring out Temporal Trends
Easily plots metrics against dates/time
Easily plots metrics against dates/time
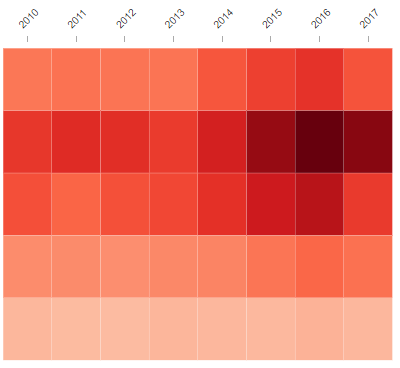
Heatmap
Highlight Trends
Easily Spot Outliers
Easily Spot Outliers
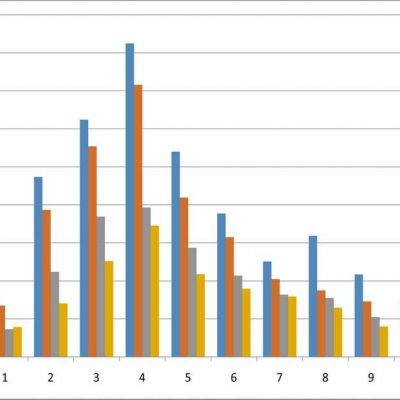
Multi-Bar Chart
Compare Categories
Spot Patterns
Spot Patterns
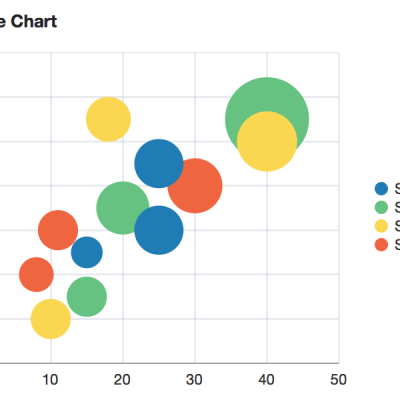
Bubble Charts
Group Information into Categories
Compare proportions
Compare proportions

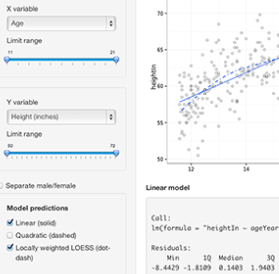
Forecasts
Numerical Predictions
Multiple forecast options
Multiple forecast options
Customizable Features
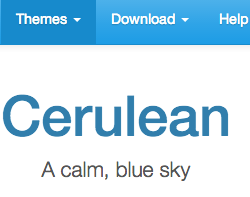
Themes
Colors, Font & Styles
Bootstrap Templates
Bootstrap Templates
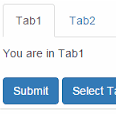
Organize Information
Tabs, Pages
Organize Your Thoughts
Organize Your Thoughts

Numeric Filters
Sliders, step-boxes, calendar input
Add Data Filters
Add Data Filters

Calendar and Date Inputs
Select Dates, Date Ranges
Filter through dates intuitively
Filter through dates intuitively

Buttons
Add rule-based interactivity
Customize App Features
Customize App Features
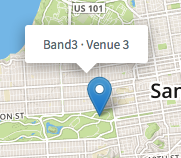
Chart Interactivity
Information from a click or mouseover
Use text and search inputs
Use text and search inputs
Layouts
Sidebar & Other Layouts
Dashboard Styling
Dashboard Styling
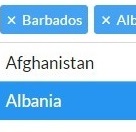
Drop-down/Select Forms
Multiple or Single Select
Discover Data Combinations
Discover Data Combinations
Upload & Download Data
Upload and download your data
Custom File Types and Size Limits
Custom File Types and Size Limits
WE USE
We build our solutions on top of some great work done by the data visualization and analytics community. Working on open source development tools gives us more flexibility to customize solutions for end users who actually consume data.